Regression with Python
1. Regression with Python
2. Simple Linear Regression
3. Multiple Regression
4. Local Regression
5. Anomaly Detection - K means
6. Anomaly Detection - Outliers

We will use the library Turicreate and the dataset from Airbnb Belgium open dataset
In [1]:
import turicreate as tc
import scipy.stats as stats
import numpy as np
import matplotlib.pyplot as plt
%matplotlib inline
In [2]:
df_rooms = tc.SFrame('https://s3.eu-west-3.amazonaws.com/pedrohserrano-datasets/airbnb-belgium.csv')Downloading https://s3.eu-west-3.amazonaws.com/pedrohserrano-datasets/airbnb-belgium.csv to /var/tmp/turicreate-pedrohserrano/13091/91587361-c28e-4d95-aae9-d4fd4c4d6e04.csv
Finished parsing file https://s3.eu-west-3.amazonaws.com/pedrohserrano-datasets/airbnb-belgium.csv
Parsing completed. Parsed 100 lines in 0.060946 secs.
------------------------------------------------------
Inferred types from first 100 line(s) of file as
column_type_hints=[int,int,str,str,str,int,float,int,float,float,str,float,float,str]
If parsing fails due to incorrect types, you can correct
the inferred type list above and pass it to read_csv in
the column_type_hints argument
------------------------------------------------------
Finished parsing file https://s3.eu-west-3.amazonaws.com/pedrohserrano-datasets/airbnb-belgium.csv
Parsing completed. Parsed 15711 lines in 0.054176 secs.
In [3]:
df_rooms.head()| room_id | host_id | room_type | borough | neighborhood | reviews | overall_satisfaction | accommodates | bedrooms |
|---|---|---|---|---|---|---|---|---|
| 14054734 | 33267800 | Shared room | Brussel | Brussel | 1 | 0.0 | 2 | 1.0 |
| 16151530 | 105088596 | Shared room | Brussel | Brussel | 1 | 0.0 | 1 | 1.0 |
| 14678546 | 30043608 | Shared room | Brussel | Brussel | 14 | 4.5 | 2 | 1.0 |
| 8305401 | 43788729 | Shared room | Namur | Namur | 12 | 4.5 | 2 | 1.0 |
| 14904339 | 15277691 | Shared room | Namur | Gembloux | 1 | 0.0 | 6 | 1.0 |
| 16228753 | 61781546 | Shared room | Antwerpen | Antwerpen | 3 | 4.5 | 2 | 1.0 |
| 643309 | 3216639 | Shared room | Roeselare | Roeselare | 6 | 4.0 | 6 | 1.0 |
| 3879691 | 19998594 | Shared room | Brugge | Knokke-Heist | 1 | 0.0 | 12 | 1.0 |
| 3710876 | 18917692 | Shared room | Antwerpen | Antwerpen | 11 | 3.0 | 3 | 1.0 |
| 5141135 | 20676997 | Shared room | Gent | Gent | 9 | 4.5 | 2 | 1.0 |
| price | minstay | latitude | longitude | last_modified |
|---|---|---|---|---|
| 55.0 | 50.847703 | 4.379786 | 2016-12-31 14:49:05.125349 ... |
|
| 42.0 | 50.821832 | 4.366557 | 2016-12-31 14:49:05.112730 ... |
|
| 43.0 | 50.847657 | 4.348675 | 2016-12-31 14:49:05.110143 ... |
|
| 48.0 | 50.462592 | 4.818974 | 2016-12-31 14:49:05.107436 ... |
|
| 59.0 | 50.562263 | 4.693185 | 2016-12-31 14:49:05.101899 ... |
|
| 53.0 | 51.203401 | 4.392493 | 2016-12-31 14:49:05.096266 ... |
|
| 22.0 | 50.941016 | 3.123627 | 2016-12-31 14:49:03.811667 ... |
|
| 33.0 | 51.339016 | 3.273554 | 2016-12-31 14:49:02.743608 ... |
|
| 33.0 | 51.232425 | 4.424612 | 2016-12-31 14:49:02.710383 ... |
|
| 38.0 | 51.034197 | 3.714149 | 2016-12-31 14:49:02.705108 ... |
In [4]:
# Make a train-test split
train_data, test_data = df_rooms.random_split(0.8)

# Automatically picks the right model based on your data.
model = tc.boosted_trees_regression.create(train_data, target='price',
                                    features = ['room_type',
                                                'borough',
                                                'neighborhood',
                                                'reviews',
                                               'overall_satisfaction',
                                               'accommodates',
                                               'bedrooms'], max_iterations=10)

# Save predictions to an SArray
predictions = model.predict(test_data)

# Evaluate the model and save the results into a dictionary
results = model.evaluate(test_data)
PROGRESS: Creating a validation set from 5 percent of training data. This may take a while.
You can set ``validation_set=None`` to disable validation tracking.
Boosted trees regression:
--------------------------------------------------------
Number of examples : 11873
Number of features : 7
Number of unpacked features : 7
+-----------+--------------+--------------------+----------------------+---------------+-----------------+
| Iteration | Elapsed Time | Training-max_error | Validation-max_error | Training-rmse | Validation-rmse |
+-----------+--------------+--------------------+----------------------+---------------+-----------------+
| 1 | 0.012864 | 1653.675049 | 684.772400 | 99.976921 | 92.150543 |
| 2 | 0.022861 | 1405.623779 | 577.419556 | 83.090813 | 76.248520 |
| 3 | 0.033853 | 1194.780151 | 532.765564 | 72.806427 | 66.368752 |
| 4 | 0.049375 | 1061.806641 | 529.710327 | 66.236198 | 60.575546 |
| 5 | 0.064744 | 944.184692 | 520.996094 | 61.931919 | 58.937630 |
| 6 | 0.078520 | 915.749634 | 518.556152 | 59.524872 | 57.983086 |
+-----------+--------------+--------------------+----------------------+---------------+-----------------+
In [5]:
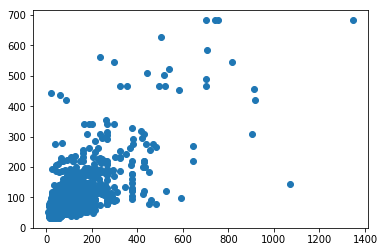
plt.scatter(test_data['price'], predictions)<matplotlib.collections.PathCollection at 0x10cd11828>

In [6]:
test_data[0]{'accommodates': 2,
'bedrooms': 1.0,
'borough': 'Brussel',
'host_id': 33267800,
'last_modified': '2016-12-31 14:49:05.125349',
'latitude': 50.847703,
'longitude': 4.379786,
'minstay': '',
'neighborhood': 'Brussel',
'overall_satisfaction': 0.0,
'price': 55.0,
'reviews': 1,
'room_id': 14054734,
'room_type': 'Shared room'}
In [7]:
predict = model.predict(test_data[0])In [8]:
print('Prediction of the room: {}'.format(predict[0]))Prediction of the room: 51.40476608276367
Written on August 16, 2018