Simple Linear Regression
1. Regression with Python
2. Simple Linear Regression
3. Multiple Regression
4. Local Regression
5. Anomaly Detection - K means
6. Anomaly Detection - Outliers

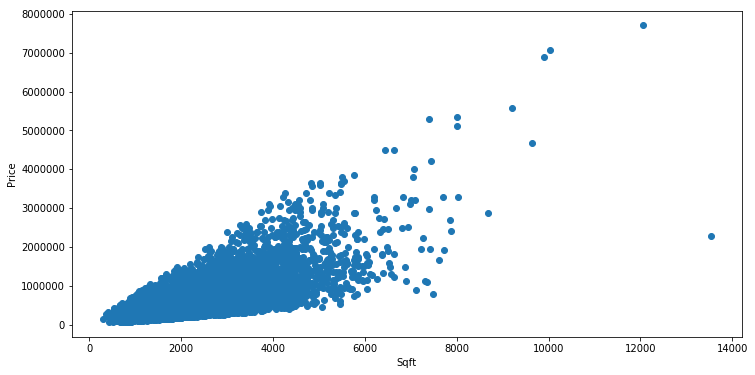
In this notebook you will use data on house sales in King County from Kaggle to predict house prices using simple (one input) linear regression. You will:
- Use graphlab SArray and SFrame functions to compute important summary statistics
- Write a function to compute the Simple Linear Regression weights using the closed form solution
- Write a function to make predictions of the target given the input feature
- Turn the regression around to predict the input given the target
- Compare two different models for predicting house prices
Anomaly Detection - Outliers
Multiple Regression
1. Regression with Python

2. Simple Linear Regression

3. Multiple Regression

4. Local Regression

5. Anomaly Detection - K means

6. Anomaly Detection - Outliers

In this notebook you will use data on house sales in King County from Kaggle to predict prices using multiple regression. We will:
- Use SFrames to do some feature engineering
- Use built-in turicreate functions to compute the regression weights (coefficients/parameters)
- Given the regression weights, predictors and outcome write a function to compute the Residual Sum of Squares
- Look at coefficients and interpret their meanings
- Evaluate multiple models via RSS
Local Regression
Anomaly Detection - Kmeans
Regression with Python
1. Regression with Python

2. Simple Linear Regression

3. Multiple Regression

4. Local Regression

5. Anomaly Detection - K means

6. Anomaly Detection - Outliers

We will use the library Turicreate and the dataset from Airbnb Belgium open dataset